Building an Kubernetes Operator for Prometheus and Thanos
This post will show you how to write a Kubernetes Operator for a fairly complex application: a Prometheus cluster connected to archival storage that queries across live and historical data for monitoring metrics.
This post will show you how I built the Prometheus Replica Operator, which is the first complex Go program I’ve written. While the Go code itself may not be the best example of software engineering, I wanted to try out my team’s Operator SDK. As the Product Manager for the Operator SDK, I want to have first hand knowledge of our tool. As an early employee of CoreOS, I do have a lot of knowledge about Operators, and I want to pass on some best practices through this post.
This subject matter is technical, but I won’t be talking about informers and other complexity in dealing with the Kubernetes API because the Operator SDK is designed so that you don’t need to know those details.
It’s also necessary to cover the architecture of Thanos and Prometheus, since that it what we’ll be operating. It’s a pretty cool piece of new tech, so I hope you find it interesting. If you don’t, it’s at least a good example of a complex application that can be modelled to run on Kubernetes.
Operator Basics
An Operator is a representation of a Kubernetes application and all of its components, such as Deployments, ConfigMaps, Secrets and Services. Instead of wrangling all of these objects, an Operator allows you to interact with a single high-level resource in similar fashion to the built-in Kubernetes abstractions.
An Operator uses Kubernetes’ plugin mechanism to provide this, which means you can use the normal tools to interact with your object:
$ kubectl get PrometheusReplicas
NAME      AGE
example   1h
Under the hood, there is a custom controller (an event loop) that is watching for the current state of PrometheusReplica objects and computing the actions that need to be taken to reach the desired state expressed in the object. This post will walk through writing this logic and explore the best ways to model your desired state.

Architecture of Thanos and Prometheus
Before we start building our Operator, let’s lay out what we’re trying to make.
Prometheus is a monitoring tool and time series database that is popular for monitoring containerized infrastructure. It uses a pull model for digesting metrics from your various app endpoints expressed as a ServiceMonitor. ServiceMonitors are useful because they can work off label queries instead of hardcoded addresses, which works well in environment when containers are starting and stopping all the time.

Prometheus stores the aggregate metrics in RAM, which is fast for querying, but quickly consumes resources. At some point, you are forced to reject new data, evict the oldest data or move data in an archival system. The problem is compounded when highly available Prometheus clusters store multiple copies of the complete data set, which eats into your RAM quota.
Until the recent introduction of Thanos, there was no choice but to throw away your older data. Thanos contains two components: a query endpoint and storage manager. The query is API compatible with a live cluster, but dynamically concatenates live data with historical data read from cloud storage. This model allows software like Grafana to present live and historical data without any changes. The storage managers also generate indexes as data moves around.
Thanos is horizontally scalable and uses a gossip protocol to discover the various components that need to query or sync data to the cloud.

While this seems pretty complicated, we’re going to express the desired state for this entire system in a 12 line YAML file. Before we start to write that file, let’s return to our specific example and see where it fits into a multi-cluster architecture.
The Ultimate Goal
I believe that multi-cluster applications are the next frontier for Kubernetes and set out to see if I could experiment with making one. My plan was to use Thanos not just for storing historical data, but federating multiple cluster metrics together by writing to the same cloud storage bucket. The blue lines below represent query requests and the red represents archival writes into the storage bucket.

I hope to expose the Query Service outside each cluster with an Ingress rule, then use round robin DNS for some degree of high availability. One hurdle (for later) will be to solve the authentication story via an OAuth proxy or hardcoded client certs, but we’ll get back to that later.
Spoiler: We’re not going to finish this all in one blog post. Let's walk through designing the objects that both of these Operators would consume, to make sure we are headed in the correct direction, then walk through implementing the Prometheus Replica Operator.
Breaking Apart the Problem
After diagramming the system architecture, its clear that there are two problems to be solved:
- Running Prometheus + Thanos on a single cluster
- Connecting each clusters together for querying, aka the multi-cluster part
CoreOS Tectonic” demonstrates the utility of a two-tier Operator architecture, and we’ll use it here to deploy a Prometheus Cluster Operator (PCO) that will talk to many Prometheus Replica Operators (PROs).
There are several benefits of this:
- Focus each component on a specific domain, and make it really good at that
- Reduce blast radius should one of our Operators go haywire
- Establish a clear security scope around each Operator
I want to expand on #3, because it’s really important. Multi-cluster security concerns are large in scope because a single piece of software must have credentials to all of the clusters. This "root on all clusters" is the biggest issue with the first iteration of Kubernetes' Federation project, and one I spoke about a Kubecon EU. The solution is to give the PCO a limited role for each cluster that only allows it to create PrometheusReplica objects, which means it won’t need access to Pods or Secrets on each cluster, because those are created locally by the PRO.

Designing the Custom Resource Definitions
Each Operator needs its own Custom Resource Definition (CRD), and we’ll be making two that work well with each other but also function separately in case a user wants to consume the PRO on its own. That becomes our first API boundary and constraint.
The beauty of an Operator is that we’re encoding knowledge of how to run Thanos into it, so the user doesn’t ever have to deal with the details for configuration, but a few things need to bubble up:
- Configuration file: Prometheus has a very rich set of config that is important for keeping the cluster performant. From experience, I know we’ll need to expose this directly as a ConfigMap.
- High availablity: Ideally we can keep this a boolean and make smart decisions about how to implement this. A great candidate for "hide the details."
- Base domain: This is going to be important when we need to connect our clusters together, since they need to talk to each other with Ingress rules. Note that this value is the basename of the Host header. Since we’re going round robin DNS, this will need to be identical on all of our clusters. This field will also be optional, if the PRO is consumed locally users can consume the internal query Service endpoint without reaching outside the cluster.
- Bucket config: The storage bucket is the backbone of our persistence and our most important Secret. Passing in an entire Secret allows for different formats to be detected (AWS vs GCP) and a separate RBAC role could be used to protect this if needed.
- Retention duration: This is the main configuration point that will control our `EmptyDir` Persistant Volume resource usage in RAM as well as bucket storage and other charges related to writing to the bucket. We will actually have two tunables for more control, but they’ll use the same string format for ease of use.
These five values will constitute our spec for a PrometheusReplica. We also need to design the status output, which is how we can use our replica once it’s set up. Let’s break down the status fields:
- Phase: This is a standard Kubernetes practice that we can use to hint if we’re still spinning things up or if anything is going wrong. For example, we might run out of quota on the cluster. This is a great place to indicate that.
- Output: The whole goal of this is to query our cluster...what hostnames do we use to do that? In this version we will only have Grafana and the query endpoint, but if we add anything new in a future version we can expand this field.
- Local: This field will track the names of the Pods that make up each tier of the apppcation. Since this CRD will eventually be wired up to multiple clusters, I wanted it to be clear that these were describing the current cluster, hence the name.
Here’s what our complete PrometheusReplica object looks like:
apiVersion: "prometheus.robszumski.com/v1alpha1"
kind: "PrometheusReplica"
metadata:
  name: "example"
spec:
  configMap: prometheus-config
  highlyAvailable: true
  baseDomain: "ingress.example.com"
  metrics:
    retention: 24h
    blockDuration: 1h
  bucketSecret: s3-bucket
status:
  local:
    prometheuses:
      - example-prometheus-0
      - example-prometheus-1
    queries:
      - example-thanos-query-7b5f6c6bc9-ttkz8
      - example-thanos-query-7b5f6c6bc9-vr59r
    stores:
      - example-thanos-store-0
  output:
    grafana: example-grafana.ingress.example.com
    query: example-thanos-query.ingress.example.com
  phase: Running
If you step back and compare this to the architecture we explored above, you don’t see any of that complexity come through. Success!
Designing the Prometheus Cluster CRD
The Prometheus Cluster CRD looks very similar but contains a few multi-cluster concepts. In this example, we're deploying PROs to each cloud region:
apiVersion: "prometheus.robszumski.com/v1alpha1"
kind: "PrometheusCluster"
metadata:
  name: "cloud-clusters"
spec:
  selector:
    matchLabels:
      platform: cloud
  configMap: cloud-prometheus-config
  highlyAvailable: true
  baseDomain: "example.com"
  metrics:
    retention: 24h
    blockDuration: 1h
  bucketSecret: s3-bucket
status:
  clusters:
    us-west:
      ingress:
        1.2.3.4
    us-east:
      ingress:
        5.6.7.8
  output:
    grafana: example-grafana.ingress.example.com
    query: example-thanos-query.ingress.example.com
As you can see, the format for the spec is largely the same, which should make it easy to debug and understand how the config is used to configure each individual cluster. I am making the assumption that most of the time you will want the clusters configured identically. If you didn’t for some reason, you could have multiple CRDs and vary the label selector accordingly.
The status field is restructured a bit, to reflect the data we will need to configure our round robin DNS to point at each cluster.
Setting Up The Operator SDK
Now that we’ve planned well for how our Operators are going to work, we can start writing code. Once getting your Go environment set up, and the SDK installed, use the SDK CLI to instantiate a new project:
$ operator-sdk new \
  promethus-replica-operator \
  --api-version=prometheus.robszumski.com/v1alpha1 \
  --kind=PrometheusReplica
This one command does a sizable amount of code generation to set up how the Operator will communicate with Kubernetes and how the event loop is structured. This one step massively lowers the barrier to writing an Operator.
Since I am new to Go, I followed the order of the getting started guide, and modeled my spec in the types file first. This was pretty easy because of the upfront design.
The easiest way to develop an Operator is to use the SDK's up local command to run the Go on your laptop against a local or remote cluster.
$ operator-sdk up local \
--kubeconfig="/path/to/kubeconfig"
Operator Logic Tree
The next step is to start modeling the logic tree for our reconciliation loop. The pre-generated code for our event handling (handler.go) is basically a giant switch statement on the type of event the Operator will listen for. In our case we care about new v1alpha1.PrometheusReplica events.
I went through several redesigns of this loop and the final iteration was a phase for calculating status, installing any components that weren't running, and updating any components that didn't match the desired state.
Status
First, gather the current cluster state for Pods, StatefulSets, Services and Deployments that the Operator owns. The main goal is to establish whether the specific PRO instance is new, being created or running normally. If the particular object has never been seen before, it is set to install. Along the way, we build the status object to be appended at the end of the loop.
My heuristic for determining whether the cluster was Running or Creating was to simply count the unique Pod states for a set of label queries. If one or more was Pending or Creating, I assume Pods were still being created. If their aren't enough resources or qualified Nodes, it may stay in this state forever.
This lazy heruistic has one problem, which is that the Thanos Pods don't have liveness and readiness checks, so that this state doesn't truly represent them being ready. For example, the Store pods require several minutes of start up time to scan and build indices before they can respond to requests. It would be great for Thanos to provide an endpoint that returned this status for a readiness probe.
Install
The Install phase of the loop can be more accurately be named "install or repair", since both are really the same action in Kubernetes, because you only need to declare your desired state. Our desired state is either to have everything running, or if something has drifed out of spec, to reset its desired state back to what we expect.
At first, the block of create functions looks simple, but there is a lot of complexity hiding behind the curtains. It works well to write a function for each resource (Deployment, etc) of your application that returns the complete object to be created. There are two uses for this: to create it and to compare the current state to the desired state in the update phase of the loop.
When writing these, I stumbled upon a few things that worked well. Since our PRO object is very simple by design, it needs to be very clear how a configuration value is used within each resource. I logged each parameter that the resource would use and what it meant. For example, highlyAvailable: true might set the replica count to 2 on a Deployment and change the value of a flag on the created Pods. Spending this extra time to include debug output helps while you're developing as well as helps an admin with debugging later on.
Since I had already deployed the entire stack manually once I figured out the architecture, I “simply” had to translate these manifests over to Go code. This was extremely time consuming and frustrating because you have to figure out all of the names Kubernetes uses internally like v1.PodAffinityTerm. I found the in-page search on the Kubernetes API to be the most efficient method. For some instances the only solution I found was to scour Github search for relevant strings within other Operators or parts of the Kubernetes code base.
Every now and again you have to try to parse what these types of errors mean:
pkg/stub/handler.go:137:23: cannot use "github.com/robszumski/prometheus-replica-operator/
vendor/k8s.io/apimachinery/pkg/apis/meta/v1".LabelSelector literal (type "github.com/robsz
umski/prometheus-replica-operator/vendor/k8s.io/apimachinery/pkg/apis/meta/v1".LabelSelect
or) as type *"github.com/robszumski/prometheus-replica-operator/vendor/k8s.io/apimachinery
/pkg/apis/meta/v1".LabelSelector in field value
The answer: some of the fields are passed by reference and some aren’t, and it’s inconsistent. I just ended up doing trial and error but you can go look at the source as well.
Another tip is around label queries. Any reasonably complex app will use a few of these, and typically need to remain in sync across resources. I recommend writing a function to return each unique label query and then use that in Service and Deployment. If you need to update it later on, you can change it in one place.
Update
Just like the install step, I figured this was going to be pretty easy, since a deep equality check between our desired state and current state is just a few lines of code:
// Update the Prometheus StatefulSet if the spec is different than desired
if !reflect.DeepEqual(ssPromExisting.Spec, ssPromDesired.Spec) {
  err = sdk.Update(ssPromDesired)
  ...
}
Turns out it’s not as easy as you think, because the object in the cluster has a bunch of default values added, eg. Protocol in the Ports section, which I did not specify in the object that I built up in the Operator.
   Ports: [
    {
     Name: "http",
     HostPort: 0,
     ContainerPort: 10902,
-    Protocol: "TCP",
+    Protocol: "",
     HostIP: "",
    },
    {
     Name: "grpc",
     HostPort: 0,
     ContainerPort: 10901,
-    Protocol: "TCP",
+    Protocol: "",
     HostIP: "",
    },
    {
     Name: "cluster",
     HostPort: 0,
     ContainerPort: 10900,
-    Protocol: "TCP",
+    Protocol: "",
     HostIP: "",
    },
   ],
I recommend that you implement debug logging with a wonderful library called godebug, which produces a pretty diff as seen above.
To be forward-compatible with new defaults that Kubernetes may add, we need to do some deeper introspection. You need to be specific in your comparison, which will require some custom functions. Because you’re diving deeper into the objects, you will also not detect all changes that may have made to the object, since you’re only comparing the container args or replica count.
My strategy was to check a few of the critical paremeters in each object. For example, on the Prometheus StatefulSet, I check:
- the total number of containers, for when we add a new one in a later version
- the labels as these are important for routing
- the replica count
- the container args where our duration and retention metrics are set
The code to do this ends up being pretty simple:
if !reflect.DeepEqual(ssPromExisting.ObjectMeta.Labels, ssPromDesired.ObjectMeta.Labels) {
  logrus.Debugf("  Prometheus does not contain the correct labels")
  logrus.Debugf(pretty.Compare(ssPromExisting.ObjectMeta.Labels, ssPromDesired.ObjectMeta.Labels))
  return true, ssPromDesired
} else {
  logrus.Debugf("  Prometheus contains the correct correct labels")
}
Now that we can sucessfully query the status of our objects and install or repair them if needed, we have a functioning Operator!
Running the Operator
Here's what it looks like to install an instance of Prometheus and Thanos with the PRO:

Spending extra time on your log output will greatly help the downstream users of your Operator. Be sure to start with the name of the object you are parsing, since more than one can exist with a namespace. Here's the full log from detection to creation of a new PrometheusReplica instance:
INFO[0000] Go Version: go1.10.2
INFO[0000] Go OS/Arch: darwin/amd64
INFO[0000] operator-sdk Version: 0.0.5+git
INFO[0000] Watching prometheus.robszumski.com/v1alpha1, PrometheusReplica, default, 5
INFO[0000] starting prometheusreplicas controller
...detected object...
INFO[0000] Parsing PrometheusReplica example in default
INFO[0000] Updating PrometheusReplica status for example
INFO[0000] Status of PrometheusReplica example is now Install
INFO[0000] Creating Prometheus StatefulSet for example
INFO[0000]   StatefulSet: Translating HighlyAvailable to 2 replicas
INFO[0000]   StatefulSet: Setting overall metrics retention to 24h
INFO[0000]   StatefulSet: Setting duration until upload to storage bucket to 1h
INFO[0000]   StatefulSet: Using Prometheus config from ConfigMap prometheus-config
INFO[0000]   StatefulSet: Using bucket parameters from Secret s3-bucket
INFO[0001] Creating Prometheus service for example
INFO[0001] Creating Thanos peers service for example
INFO[0001] Creating Thanos store StatefulSet for example
INFO[0001]   StatefulSet: Using bucket parameters from Secret s3-bucket
INFO[0001] Creating Thanos store service for example
INFO[0001] Creating Thanos query Deployment for example
INFO[0001]   Deployment: Using bucket parameters from Secret s3-bucket
INFO[0001]   Deployment: Translating HighlyAvailable to 2 replicas
INFO[0001] Creating Thanos query service for example
INFO[0001] Checking desired vs actual state for components of PrometheusReplica example
INFO[0002] Creating Prometheus StatefulSet for example
INFO[0002]   StatefulSet: Translating HighlyAvailable to 2 replicas
INFO[0002]   StatefulSet: Setting overall metrics retention to 24h
INFO[0002]   StatefulSet: Setting duration until upload to storage bucket to 1h
INFO[0002]   StatefulSet: Using Prometheus config from ConfigMap prometheus-config
INFO[0002]   StatefulSet: Using bucket parameters from Secret s3-bucket
INFO[0002]   Checking StatefulSet for Prometheus
INFO[0004] Parsing PrometheusReplica example in default
INFO[0004] Updating PrometheusReplica status for example
INFO[0004] Status of PrometheusReplica example is now Creating
INFO[0005] Checking desired vs actual state for components of PrometheusReplica example
INFO[0005]   Checking StatefulSet for Prometheus
INFO[0005]   Checking Deployment for Thanos query
...create is now done...
INFO[0005] Parsing PrometheusReplica example in default
INFO[0005] Updating PrometheusReplica status for example
INFO[0005] Status of PrometheusReplica example is now Running
INFO[0006] Checking desired vs actual state for components of PrometheusReplica example
INFO[0006]   Checking StatefulSet for Prometheus
INFO[0006]   Checking Deployment for Thanos query
...looping...
INFO[0006] Parsing PrometheusReplica example in default
INFO[0006] Updating PrometheusReplica status for example
INFO[0007] Checking desired vs actual state for components of PrometheusReplica example
INFO[0007]   Checking StatefulSet for Prometheus
INFO[0008]   Checking Deployment for Thanos query
...loop forever...
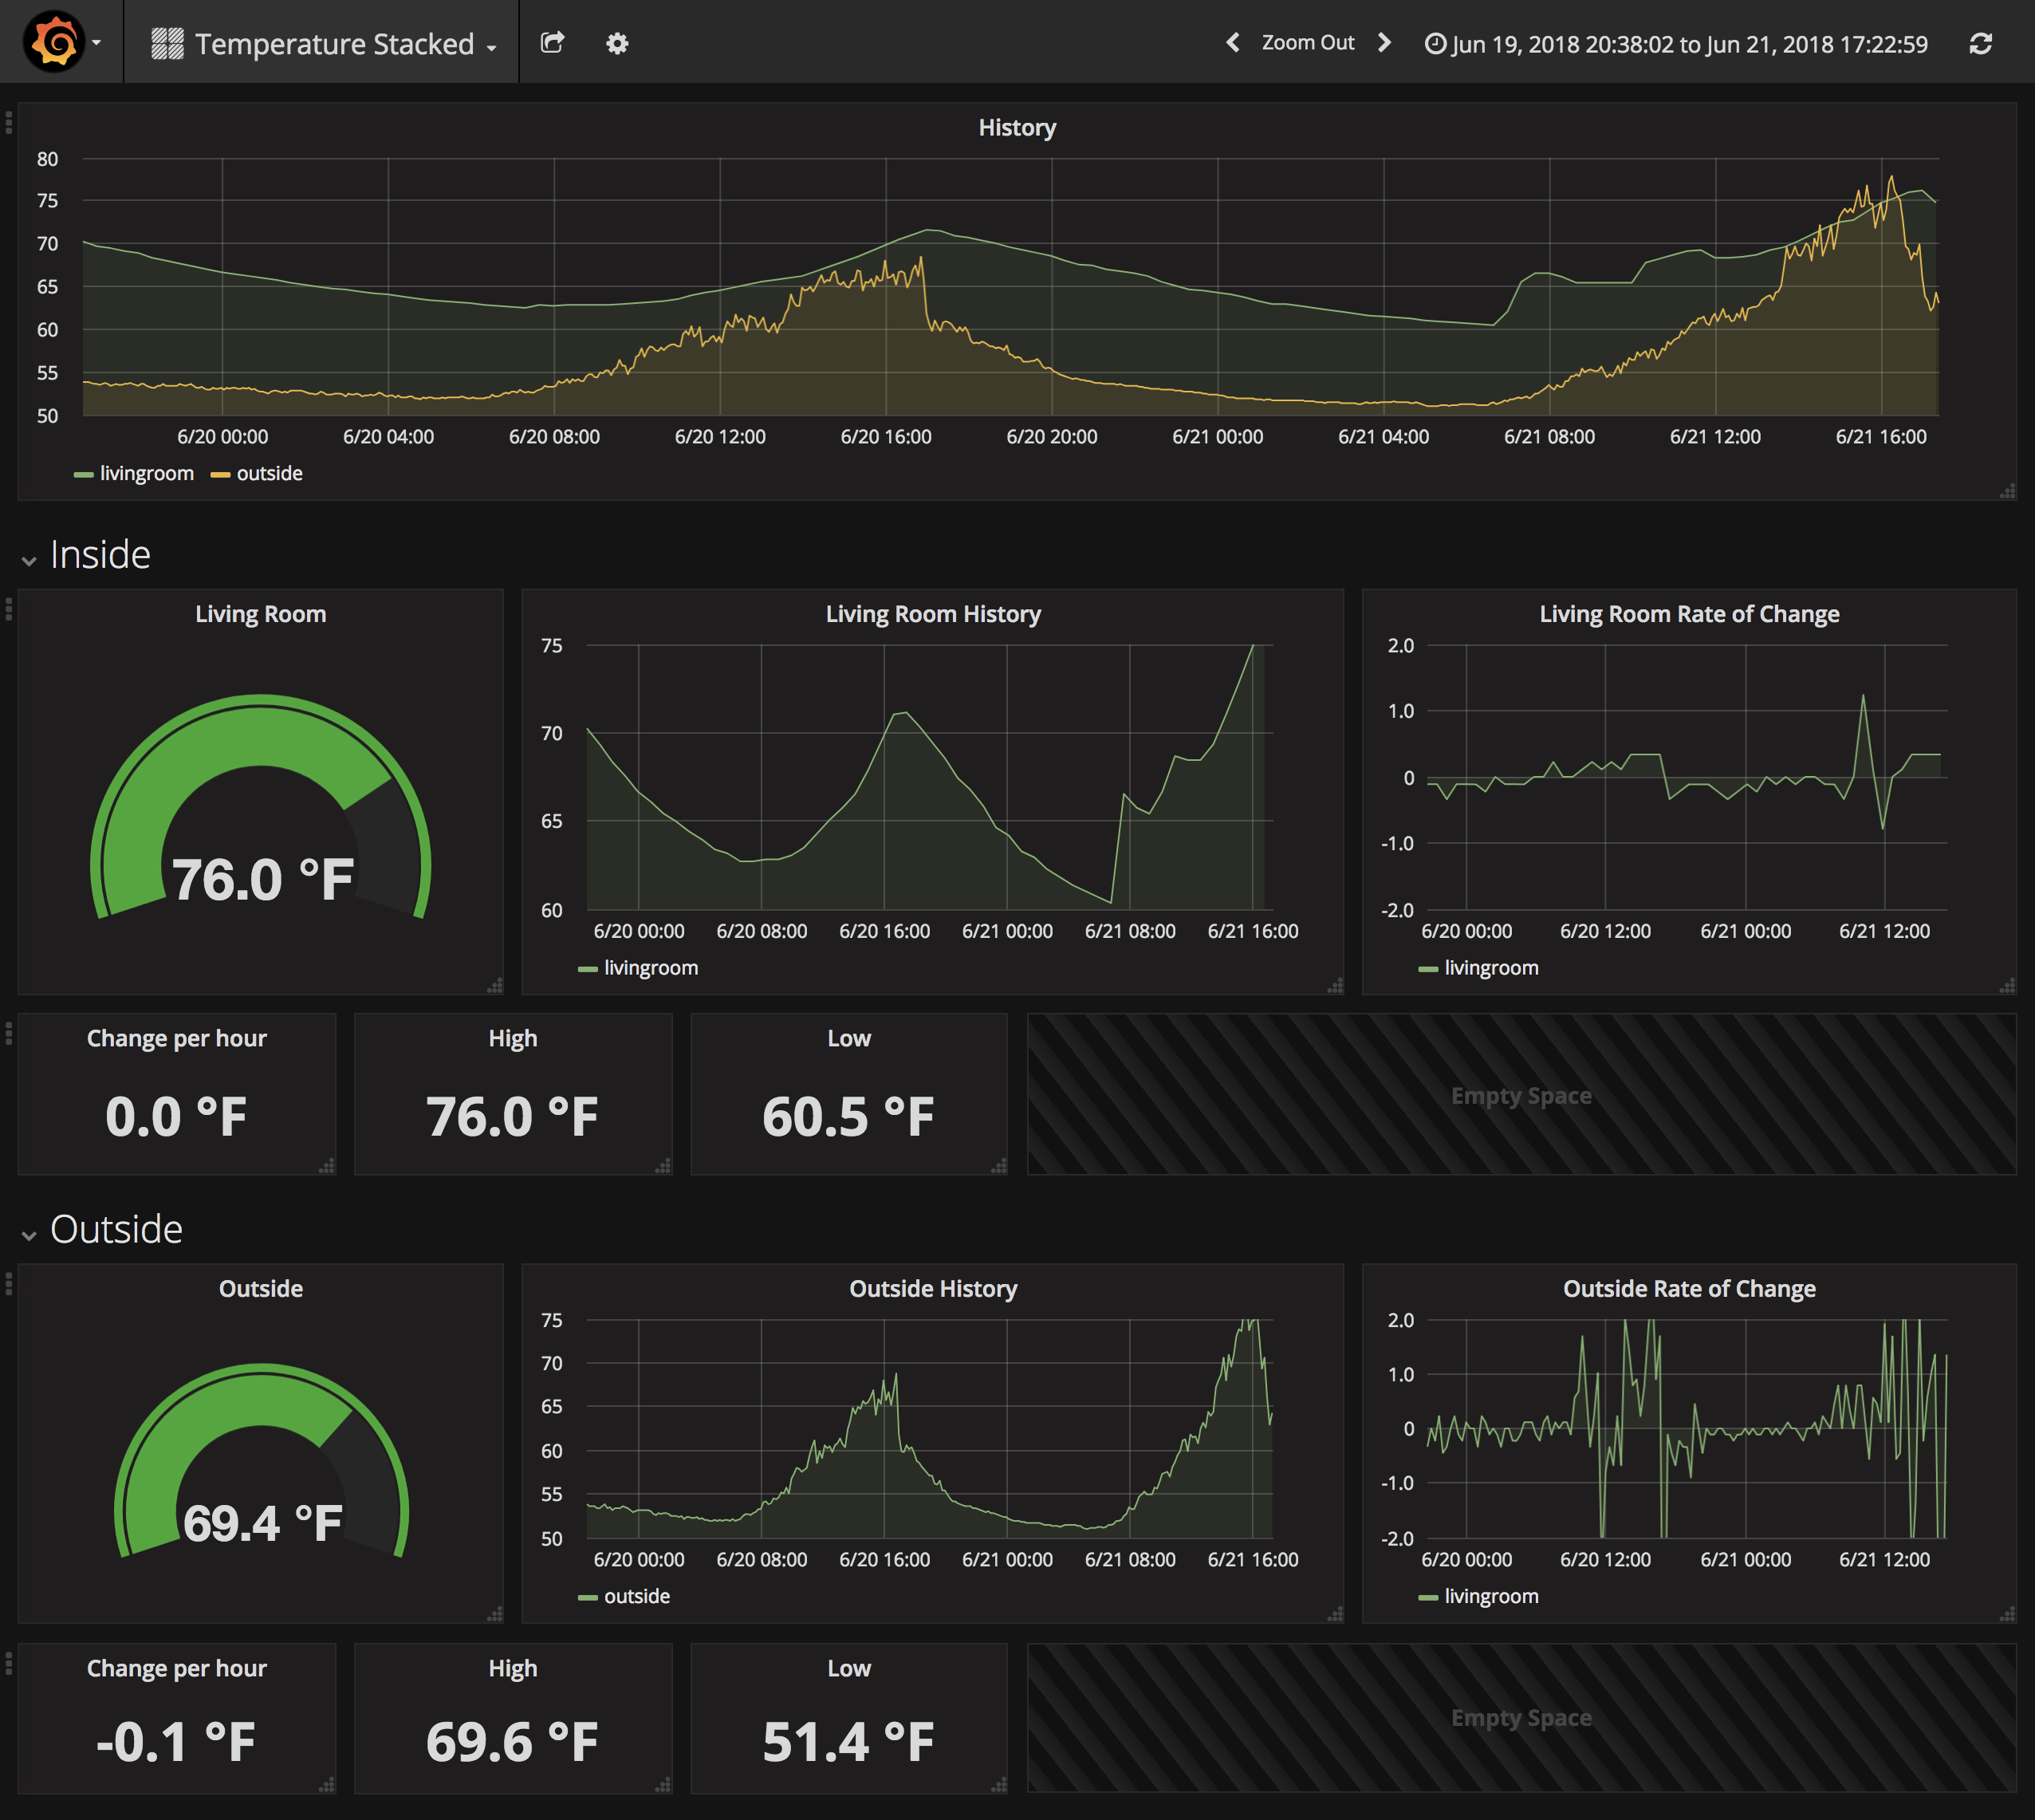
To prove that it really works, I have a Grafana dashboard set up, pointed at the Query endpoint run by Thanos. I use Prometheus to track the temperature of my home, which makes a great dataset to test the Operator. The configuration above set our retention length to 24 hours, so the screenshot shows how all data past this limit is fetched seamlessly from the S3 bucket.
At this point, the initial version of our Prometheus Replica Operator is done.
Building and Distributing your Operator
Once you're ready to release a version of your Operator, it needs to be packaged as a container so others can run it. The SDK has a command to do this:
$ operator-sdk build quay.io/robszumski/prometheus-replica-operator:v0.0.1
Users of your Operator need to be provided a manifest to run it on their own clusters. The SDK has created a Deployment for you in deploy/operator.yaml that points to the image pushed above.
Requiring engineers to manually run the Deployment is fine for one-off scenarios, but full lifecycle management of Operators is important to realize The Dream™: an environment that can seamlessly update Operators, which in term seamlessly update the application instances that they manage.
Next Steps
I hope you enjoyed a walk through the process of making an Operator with the Operator SDK. You can check out the code for the Prometheus Replica Operator on GitHub. For questions, advice and more join the #kubernetes-operators channel on the Kubernetes Slack and the Operator Framework Special Interest Group (SIG).
The Operator SDK is just one component of the Operator Framework:
- Operator SDK: tools for building and distributing Operators.
- Operator Lifecycle Manager: software to manage the install/upgrade experience of Operators being run by teams on a shared cluster. Includes access control for admins to restrict Operator usage at the namespace level.
- Operator Metering: insight into the health and status of Operators. Track application specific metrics such as heal actions across multiple GlusterFS clusters.